Robot uptime is not one universal percentage. A controller can be powered while the robot is waiting for material, blocked by downstream equipment, recovering from a policy failure or producing rejected parts. The metric requires a declared equipment boundary, denominator and event taxonomy.
MTBF, MTTR, availability and OEE answer different questions. Reliability describes failure recurrence, maintainability describes restoration, availability combines operating and unavailable intervals, and OEE adds performance and quality losses within a production context.
Use this guide with the multi-robot fleet guide and robot failure-mining guide. Preserve raw events so every KPI can be recalculated when definitions change.
Choose the system boundary before calculating uptime
Decide whether the measured object is a joint, robot, workstation, cell, fleet service or production line. A robot may be technically available while the cell cannot run because a feeder, safety device, quality station or upstream service has failed.
Name the task and operating modes included. A demonstration success rate measured over selected trials cannot be compared directly with an attended production shift containing setup, faults, changeovers and material variation.

Lock the time denominator and exclusion rules
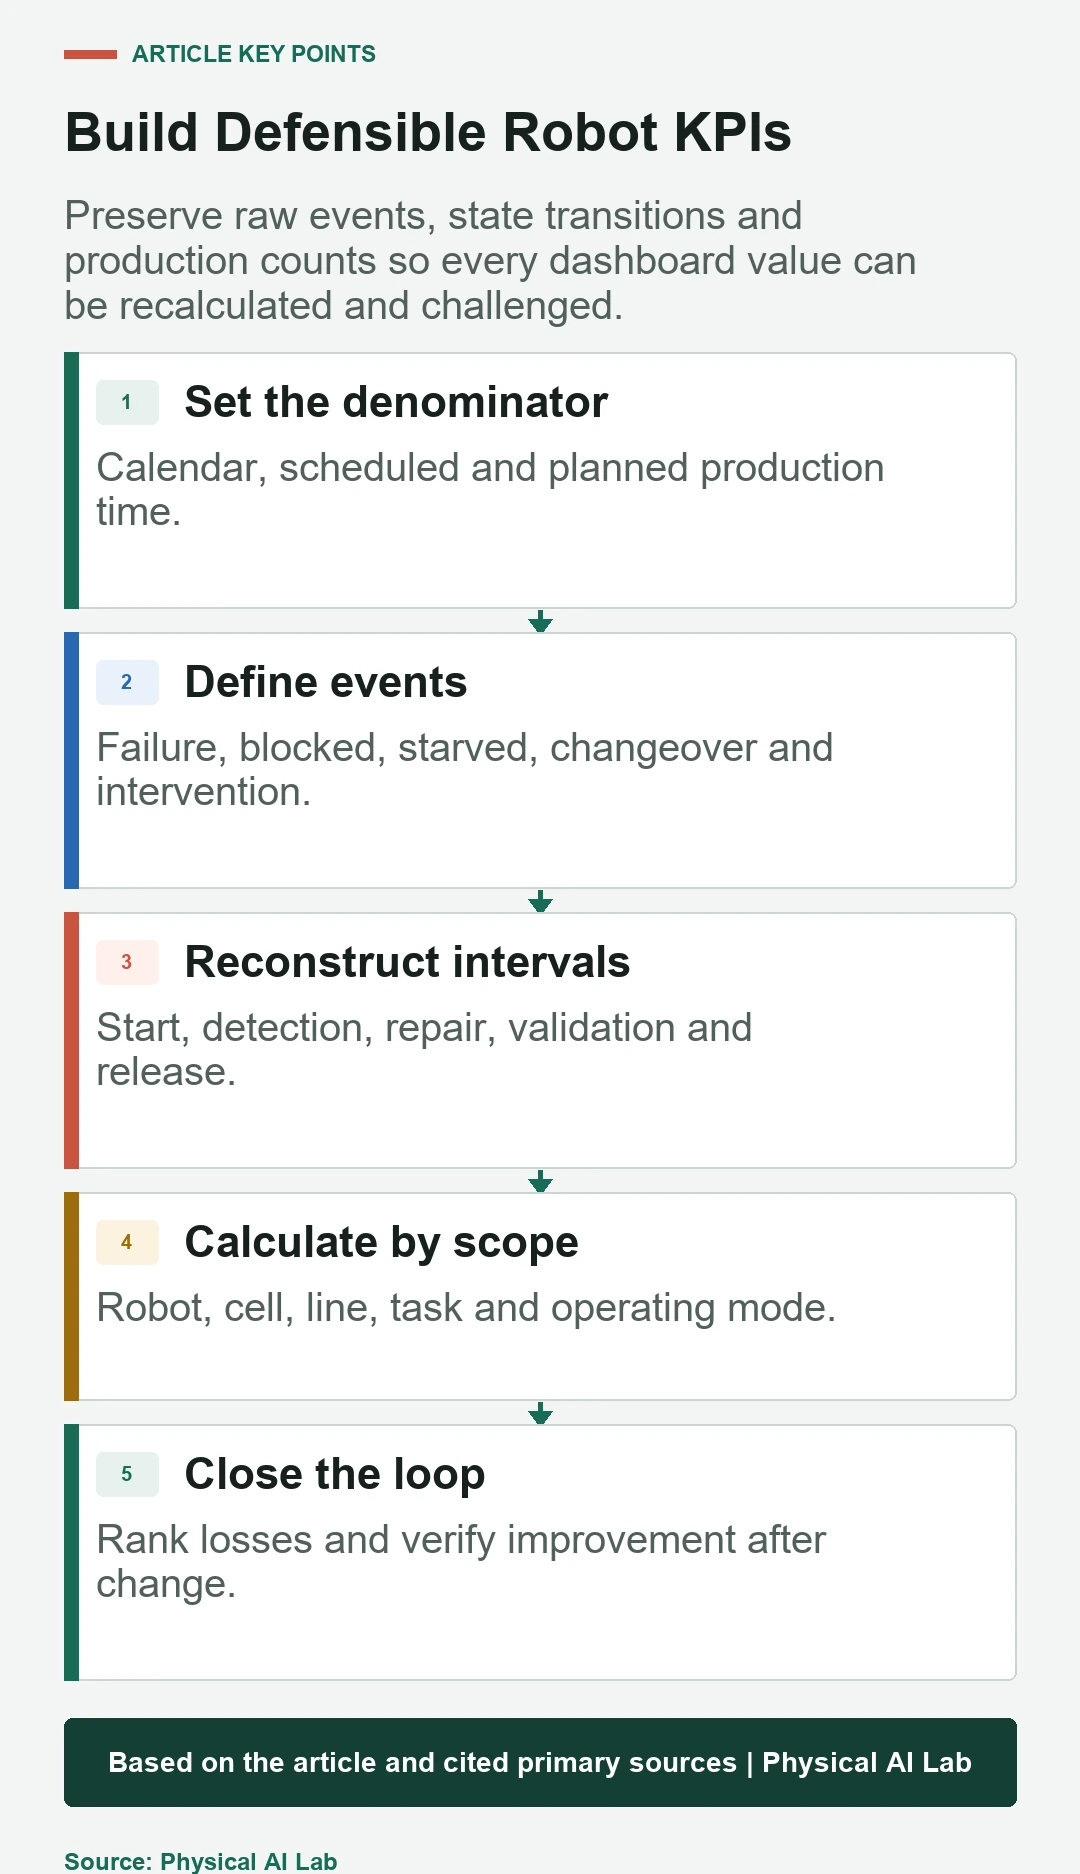
Calendar time, scheduled time, planned production time and commanded mission time create different ratios. Planned shutdowns, breaks, preventive maintenance and engineering trials must be consistently included or excluded according to the decision the KPI supports.
Store raw timestamps and labels instead of only daily percentages. Governance can then reproduce the result when a contract, site or benchmark uses a different denominator.
| Time basis | Includes | Useful question | Common distortion |
|---|---|---|---|
| Calendar time | All elapsed time | Always-on service capacity | Planned shutdown dominates |
| Scheduled time | Rostered availability | Operational readiness | Break policy differs |
| Planned production | Expected making time | OEE production loss | Schedule can hide demand |
| Mission time | Assigned task window | Robot-task performance | Starved time disappears |
| Safety exposure | Relevant operating modes | Risk and intervention trend | Mixed with productivity |
Separate equipment failure from task and policy failure
A hardware fault that requires repair is not the same event as a failed grasp followed by an automatic retry. Both may reduce output, but they belong to different reliability populations, causes and improvement owners.
Create event classes for equipment fault, safety stop, software crash, task failure, human intervention, blocked, starved, changeover, planned service and external utility loss. Preserve cause confidence and later corrections.
Use MTBF only with a defined repairable population
The IEC Electropedia defines MTBF as mean operating time between failures. State the failure definition, observation time, asset population, censoring and whether the estimate represents a stable operating regime.
Do not invert a short test’s average failure count into a precise lifetime claim. Report counts, exposure and uncertainty, and segment materially different hardware, firmware, task and environment conditions.
Decompose MTTR into detection, access, repair and release
Mean time to repair is often ambiguous because operations also wait for detection, remote triage, spares, safe access, technician arrival, validation and production release. Store these intervals separately before choosing the aggregate used in a dashboard.
A faster reboot can reduce restoration time without fixing a recurring cause. Compare temporary recovery, permanent corrective maintenance and later recurrence so availability work does not optimize only the visible reset step.
Calculate availability from consistent operating and downtime states
For a repairable system under suitable assumptions, inherent availability is often related to MTBF and mean repair time, but operational availability also reflects logistics, administration and planned conditions. Do not mix formulas with event data defined on another boundary.
Show numerator, denominator and state map beside the result. A percentage without the underlying unavailable hours, event count and longest outages conceals the losses that an engineering team can actually reduce.
Use OEE to separate availability, performance and quality loss
OEE multiplies availability, performance and quality components within a declared production interval. Availability captures stop loss, performance captures running below ideal rate and quality captures output that is not accepted as good production.
The official ISO catalog says ISO 22400-2:2014 defines manufacturing-operations KPIs and is being revised; ISO 22400-1:2014 remains current as the KPI framework. Use the applicable edition and local production definition rather than an undocumented spreadsheet formula.
Model blocked and starved states across the cell
A robot waiting for an empty feeder and a robot unable to unload into a full downstream buffer are different constraints. If both appear as idle, teams may tune robot cycle speed even though flow, replenishment or balancing is the bottleneck.
Use shared cell timestamps and causal state transitions. Allocate loss consistently without double-counting the same line stop against every machine, while retaining each asset’s local symptoms for diagnosis.
Build an event ledger from state transitions
Record event ID, asset and cell, state, reason, start, detection, acknowledgement, repair start, functional restoration, validation and release. Store software, model, map, tool, product and operator-role context with controlled privacy.
Automatic transitions need debounce and precedence rules so flapping signals do not create thousands of false failures. Manual reason edits should retain author, time and original value.
Segment KPIs and show statistical uncertainty
Compare by task, product, shift, site, payload, hardware revision, software version and environment only when exposure is adequate. A fleet average can hide one rare configuration with repeated long outages.
Report observation hours, event counts, quantiles and confidence intervals where appropriate. Median repair time and the 95th percentile often reveal a different operational problem from the mean.
Turn loss ranking into a verified improvement loop
Rank total lost time, recurrence, severity and controllability. Use Pareto views as investigation entry points, then link each action to a root-cause hypothesis, controlled change and post-change observation window.
Policy uncertainty and repeated intervention can be compared with the policy uncertainty guide, but do not relabel all AI task difficulty as equipment downtime. Keep reliability and task-performance ledgers linked but distinct.
Release a governed KPI definition sheet
For each metric, preserve owner, purpose, asset boundary, population, time basis, event classes, formula, units, data sources, quality checks, exclusions, revision history and decision threshold. Validate dashboard totals against sampled raw timelines.
Close review with the following checks.
| Metric | Minimum context | Diagnostic companion | Misuse warning |
|---|---|---|---|
| Uptime | Boundary and denominator | Unavailable hours | Power-on called productive |
| MTBF | Failure class and exposure | Failure count and confidence | Short demo extrapolated |
| MTTR | Start and end events | Repair-stage durations | Reboot treated as root fix |
| Availability | State model | Outage distribution | Formula boundary mismatch |
| OEE | Ideal rate and good output | A, P and Q components | Robot-only claim for line |
- Declare asset and production boundaries.
- Publish denominator and exclusion rules.
- Separate failure, intervention, blocked and starved states.
- Retain counts, exposure, distributions and raw intervals.
- Verify improvement with the same definition before and after change.
Frequently asked questions
Is robot uptime simply powered-on time?
No. Power, technical availability, commanded mission availability and productive cell time are different states.
Can MTBF be calculated from five failures?
A numerical estimate is possible, but uncertainty and population assumptions may make it unsuitable for a strong claim.
Does MTTR include waiting for a technician?
Only if the published definition includes logistics delay; store repair stages separately so the choice is visible.
Is OEE a robot performance score?
Not by itself. OEE is a production KPI shaped by the declared cell boundary, ideal rate and good-output definition.
Should automatic retries count as failures?
Record them as task or policy events and their production loss; include them in equipment MTBF only if they satisfy that metric’s failure definition.
KPI Definition and Scope Boundary
A robot KPI is defensible only when its asset boundary, time denominator, event definitions, raw evidence and uncertainty are controlled. Use the metric to change decisions, not to decorate a dashboard.