Robot inference latency is the elapsed time from a physical observation becoming available to a corresponding command taking effect. Neural-network runtime is only one interval. Exposure, sensor buffering, transfer, decoding, preprocessing, queueing, postprocessing, middleware, controller scheduling and actuator application can be equally important.
A useful budget follows one frame or state sample with synchronized timestamps. It distinguishes processing duration from data age and reports the median, high percentiles and maximum observed under a defined workload. Throughput and frames per second do not answer how old a command is when the robot applies it.
Use this guide with the ROS 2 real-time control guide and robot VLA evaluation guide. Keep a bounded lower-level control loop even when the perception or policy path has variable latency.
Define physical start and stop timestamps
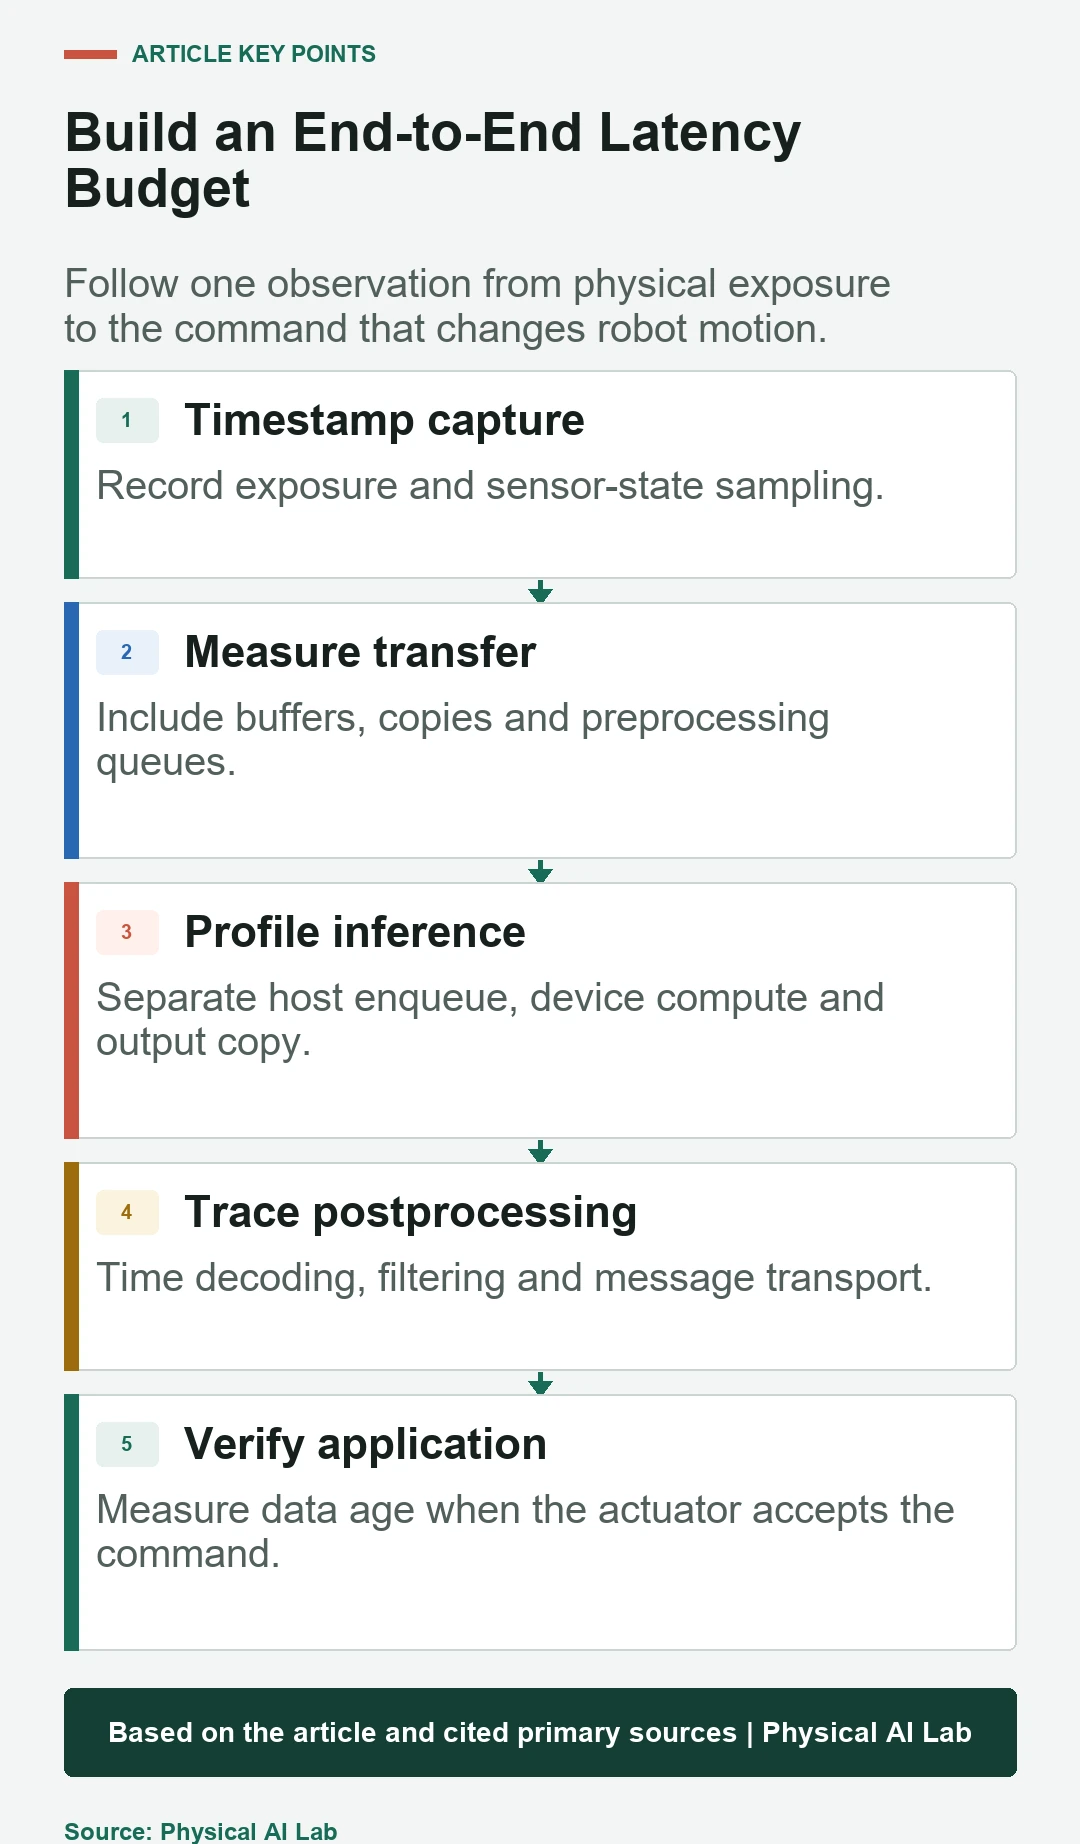
Choose the start at camera exposure, lidar acquisition or robot-state sampling, not when an application callback happens to run. Choose the stop at the controller or drive event that accepts or applies the command. Software entry and return times omit transport and hardware delay.
Use a shared clock or characterize clock offset and drift. Hardware timestamps are preferable where available. Preserve sequence identifiers from input to output so one can prove which frame produced each action. Without identity, a fast callback may be processing an old buffered frame.

Sensor capture creates age before inference starts
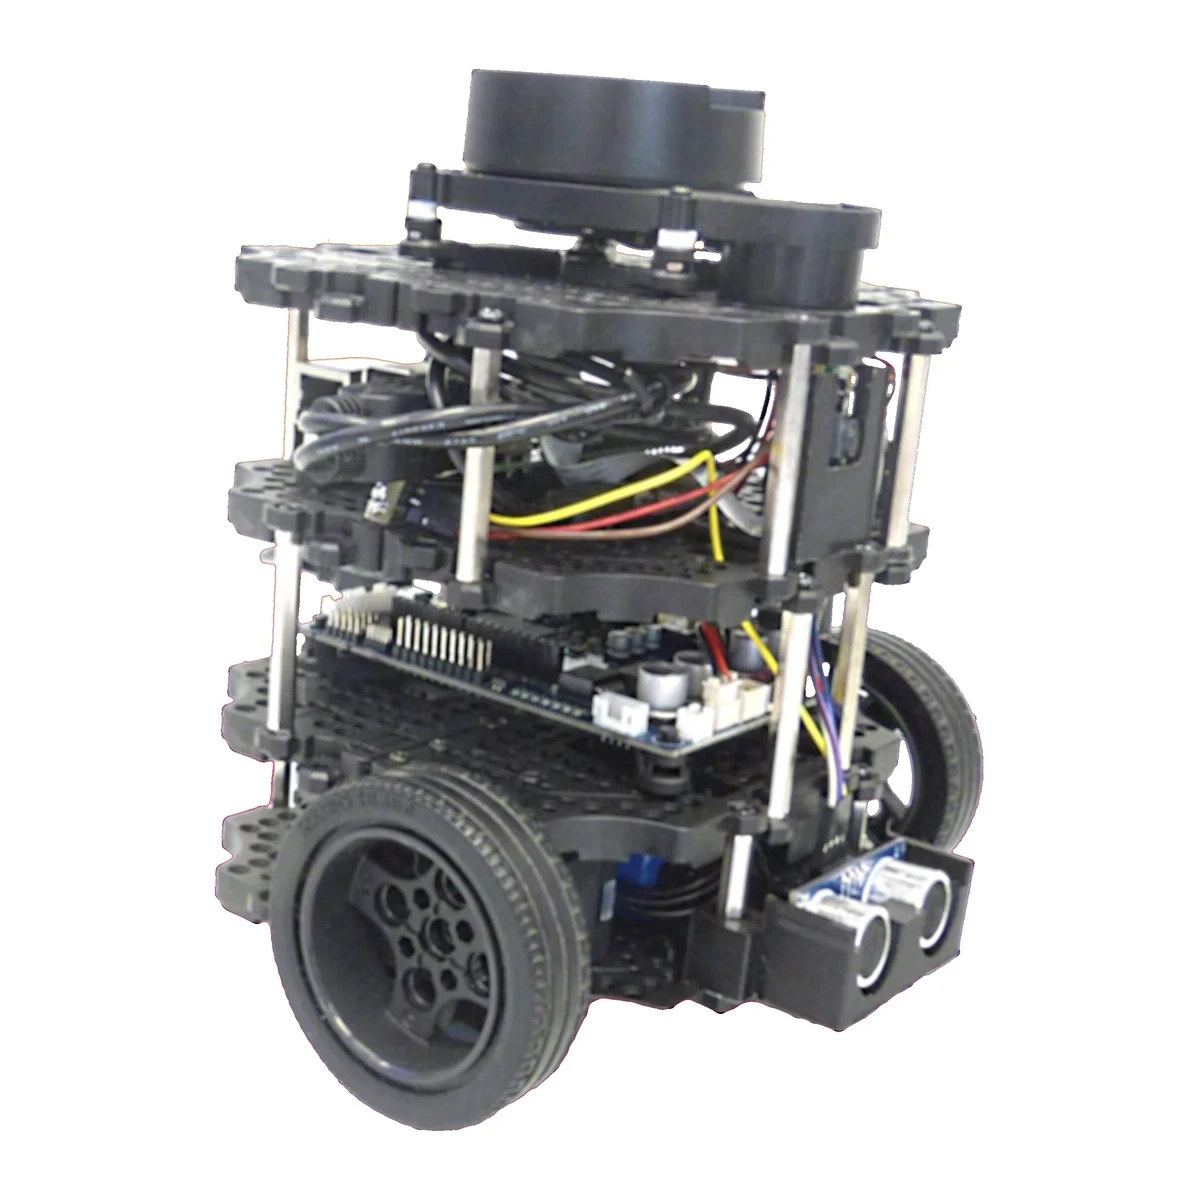
Rolling shutter, exposure time, frame readout and sensor-side image processing add latency. A camera operating at 30 frames per second can deliver a frame that represents different row times and has already spent a fraction of a frame period in capture before host transfer.
Document trigger mode, exposure, buffer depth, drop policy and timestamp origin. A latest-only consumer may keep low age by dropping frames, while a queued consumer preserves every frame but becomes increasingly stale under overload. Neither policy is universally correct; the control consequence decides.
| Stage | Start event | End event | Hidden delay |
|---|---|---|---|
| Capture | Physical exposure | Sensor frame ready | Readout and ISP |
| Transfer | DMA or packet send | Host buffer available | Copy and bus queue |
| Preprocess | Frame selected | Input tensor ready | Decode and resize |
| Inference | Request enqueued | Output synchronized | Host and device work |
| Application | Output decoded | Drive accepts command | Middleware and control phase |
Copies and queues can exceed model compute
Image decoding, color conversion, resize, normalization, host-to-device copies and tensor layout changes may each create buffers. Zero-copy designs can reduce transfers but add lifetime and alignment constraints. Profile actual memory movement rather than assuming the framework eliminated it.
Instrument queue wait separately from service time. CPU thread contention, callback executors, GPU streams and asynchronous drivers can hide waiting between visible functions. Bound queue depth and define whether an arriving input replaces, skips or waits behind earlier work.
Model latency requires explicit synchronization
GPU launch APIs are often asynchronous. Measuring only the host call can record enqueue time rather than completed inference. Use appropriate device events or synchronize at the output boundary, while retaining a wall-clock measurement around the complete application path.
Current TensorRT performance benchmarking documentation separates throughput, host latency, transfers, GPU compute and enqueue time. Its inference-only metrics are useful for isolation but do not include the robot sensor and controller stages unless the application measures them.
Throughput and latency answer different questions
Throughput is completed inferences per unit time. Latency is elapsed time for one request. Batching or concurrent streams may improve aggregate throughput while increasing the waiting time or contention seen by an individual robot frame. Report both under the same scheduling configuration.
A pipeline can also have high throughput and unbounded age if production exceeds consumption and a queue grows. Plot frame age at command application alongside inference count. For control, a lower-rate latest observation is often more useful than every stale observation delivered in order.
| Metric | What it answers | Statistic | Robot risk |
|---|---|---|---|
| Model compute | How long device kernels run | Median and tail | Missed policy period |
| End-to-end latency | How long one observation takes | P50, P95, P99, max | Late reaction |
| Data age | How old evidence is at use | Distribution | Stale command |
| Throughput | How many requests finish | Per second | Queue growth |
| Jitter | How timing varies | Range and percentile | Uneven control |
Tail latency determines rare physical failures
Mean latency hides scheduler pauses, first-use compilation, cache misses, thermal throttling, dynamic shapes and network retries. Record warm-up separately, then run long enough to observe rare contention. Report P95 and P99 only with sample counts sufficient to interpret those percentiles.
Track worst observed value without calling it a proven upper bound unless the system and analysis support that statement. Correlate outliers with power, temperature, clocks, CPU load, memory pressure, network and profile changes. A few late commands can dominate collision or grasp failures.
Onboard, edge and cloud paths have different budgets
Onboard inference avoids wide-area network variation but shares power and thermal limits with the robot. Edge servers add radio, switching and queueing while offering more compute. Cloud paths add routing and service contention and need a defined behavior for disconnection or delayed responses.
Measure round-trip distributions in the real deployment region and under roaming or interference. Do not send a command conditioned on a frame that has exceeded its age limit. Use sequence and deadline checks at the robot so a late but validly authenticated response cannot move the current state.
Optimization trades accuracy, load and scheduling
Reduced precision, quantization, pruning, lower resolution and frame skipping can reduce compute, but each changes model output. Validate task accuracy and failure modes after optimization on the target hardware. A faster engine with a shifted calibration or unsupported operator is not an equivalent policy.
The current TensorRT best-practices guide recommends controlling clocks, power, thermal state, transfers and software configuration for reproducible numbers. Pin the built engine to its hardware and driver environment rather than comparing a vendor benchmark with a different robot.
Policy rate and servo rate should be decoupled
A vision or VLA policy may update at tens of hertz while joint control runs hundreds or thousands of times per second. The lower layer can interpolate bounded references, monitor tracking and reject stale commands. It should not wait inside the hard timing path for a neural inference.
Coordinate horizon with the robot action-chunking guide. Log prediction time, execution prefix and command age. If inference misses its deadline, choose a tested fallback such as hold, decelerate or transition to a safer state rather than replaying an arbitrary old action.
Validate timing under realistic stress
Run representative cameras, logging, networking, mapping and UI workloads together. Vary temperature, power mode, dynamic shapes, object count and background traffic. Inject dropped frames, delayed packets and inference overruns while measuring the robot response.
Keep a versioned latency budget with targets and measured distributions for every stage. Recheck after model, preprocessing, middleware, driver, firmware or compute changes. A stage optimization should be accepted only when the complete sensor-to-actuator path and task outcome improve.
- Timestamp physical capture and command application.
- Carry sequence identity through every stage.
- Separate queue wait, host work and device work.
- Report latency tails, throughput and data age.
- Test overload, heat, network loss and fallback behavior.
Frequently asked questions
If the model runs in 10 ms, does the robot react in 10 ms?
No. Capture, transfers, preprocessing, queues, postprocessing, communication, controller scheduling and actuator response remain outside model compute.
Are FPS and latency the same metric?
No. FPS is throughput. A pipeline can complete many frames per second while an individual frame waits in a queue and reaches the robot late.
Why is average latency insufficient?
Rare stalls can cause the physical failures that matter most. Report percentiles, maximum observed values, sample counts and the conditions associated with outliers.
Can old frames simply be dropped?
Often a latest-only policy reduces age, but dropping changes temporal sampling and model behavior. Validate the drop rule with the task and controller.
Can cloud inference be used for robots?
It can support tasks whose deadline and fallback tolerate network variation. Measure the real path and reject responses that exceed the robot command-age limit.
Inference Timing Evidence Boundary
Latency figures apply to a defined sensor, model, hardware, software, load and measurement boundary. Inference benchmarks alone are not evidence of a bounded robot reaction time.