Robot motor sizing starts with a representative time history of joint torque and speed. The motor must survive continuous thermal load, deliver transient acceleration and disturbance torque, reach required speed within available bus voltage, and remain inside drive, gearbox and mechanical limits.
Catalog continuous and peak torque are not interchangeable with application RMS and maximum demand. Peak capability depends on duration, speed, winding temperature, drive current and repetition. Gear ratio changes motor torque and speed while reflected inertia and efficiency alter the expected benefit.
Use this guide with the actuator torque-density guide and joint friction guide. Confirm calculations against supplier curves and a representative hardware cycle.
Begin with the joint task trajectory
Describe position, velocity and acceleration over a complete repeated task, including rest, acceleration, constant motion, braking, holding and dwell. Include payload and posture cases that maximize gravity, inertia, speed and external contact. A single worst pose cannot represent thermal repetition.
The Oriental Motor sizing reference provides foundational load and acceleration calculations. Use equations appropriate to the mechanism, then preserve assumptions, units and sign conventions in a reviewable worksheet or model.

Partition the duty cycle into timed segments
Break the representative cycle into segments with duration, joint speed, acceleration, load and cooling condition. Include negative torque and regeneration during deceleration. Idle time can reduce RMS load, but a powered hold may still produce current and heat.
Use multiple cycles for normal production, high payload, recovery and maintenance. Record occurrence rate. A rare high-load recovery may govern peak current, while a common lighter cycle governs continuous temperature.
| Segment | Torque contributors | Speed state | Sizing output |
|---|---|---|---|
| Hold | Gravity, friction, external | Zero or low | Continuous current |
| Accelerate | Gravity, inertia, friction | Rising | Peak torque and current |
| Constant travel | Gravity, friction, external | High | Torque-speed point |
| Brake | Inertia, gravity, friction | Falling | Regeneration and peak |
| Dwell | Hold or disabled losses | Zero | Cooling interval |
Sum gravity, inertia, friction and external torque
At the joint, calculate torque from gravity and payload moment, link and load inertia times angular acceleration, friction and external process force. Use conservative but traceable coefficients. Do not hide every uncertainty inside one large safety factor because it obscures the true limit.
Multiaxis robots require coupled dynamics and posture-dependent loads. Use a validated rigid-body model or measured trajectory torque where appropriate. Check sign because gravity can assist one motion and oppose another, changing both motor demand and regenerative energy.
Reflect joint demand through the gearbox
Convert joint speed to motor speed with ratio and joint torque to motor torque with ratio and efficiency. Apply efficiency in the correct power direction; driving and backdriving can differ. Include gearbox torque, speed, thermal, backlash and life limits independently.
A higher ratio reduces motor load torque but raises motor speed and reflected motor-side effects. It can reduce backdrivability and increase losses. Sweep candidate ratios rather than assuming the largest value permits the smallest motor.
Include reflected inertia in acceleration demand
Reflect load inertia to the motor shaft by the square of the gear ratio convention used in the model, then add motor rotor, gearbox input and coupling inertia. Motor acceleration torque depends on the total inertia seen at that shaft.
Check inertia ratio guidance from the chosen motor and drive supplier, but do not treat one rule as universal. Closed-loop bandwidth, compliance, backlash and trajectory shape influence acceptable mismatch. Validate tracking and stability on hardware.
| Limit | Calculation or source | Must include | Failure symptom |
|---|---|---|---|
| RMS torque | Timed squared torque average | All powered segments | Thermal rise |
| Peak torque | Maximum time point | Duration and repetition | Current limit or demagnetization |
| Maximum speed | Motor trajectory | Bus sag and back-EMF | Speed saturation |
| Drive current | Torque constant and waveform | Continuous and peak duration | Drive trip |
| Gearbox | Joint output cycle | Efficiency, life and shock | Wear or overheating |
Calculate RMS torque over the full cycle
RMS torque is the square root of the time-weighted mean of squared motor torque. Include acceleration, travel, braking, hold and dwell whenever current flows. Because torque is squared, positive and negative demand both contribute to copper heating.
Compare application RMS with continuous capability at the actual speed, ambient, enclosure and cooling. A catalog continuous value based on a heat sink or airflow may not apply inside a sealed compact joint. Include thermal coupling from the drive and gearbox.
Check peak torque as magnitude, time and repetition
Maximum calculated torque must stay inside motor and drive torque-speed envelopes. Confirm how long the supplier permits that level, initial winding temperature and required recovery. A peak rating without time is not an application limit.
Model repeated shocks, impacts or emergency moves separately. Avoid routinely operating at transient limits because uncertainty, aging and manufacturing variation can remove margin. Verify current saturation behavior and whether torque control remains accurate near the limit.
Close the high-speed voltage margin
At high speed, back electromotive force and resistive voltage drop consume the available drive output. PWM modulation, bus sag, cable drop and drive overhead reduce the voltage available to force current. A motor can meet torque at low speed yet fail at the required top speed.
Plot the complete motor torque-speed trajectory against the supplier curve at minimum operating bus voltage. Include field weakening only when the motor and drive support it and the resulting torque, efficiency and thermal behavior are validated.
Model duty cycle and thermal path
Copper loss approximately follows current squared times resistance, while iron, switching, bearing and gearbox losses depend on speed and operation. Winding resistance rises with temperature, altering voltage demand and loss. A lumped thermal model can screen designs but requires measured parameters.
Define ambient, enclosure, contact surfaces, airflow, cooling fluid and neighboring heat sources. Test heat soak over enough repeated cycles to approach steady state or the worst mission duration. Measure winding temperature with a supported estimator or sensor, not housing temperature alone.
Size the motor, drive, bus and gearbox together
Motor torque constant determines current demand; the drive must supply continuous and peak phase current with appropriate switching and thermal limits. The DC bus must support simultaneous axes and regenerative energy. Connectors, cables, fuses and cooling share the same duty cycle.
Iterate candidate combinations because changing ratio, winding, bus voltage or trajectory can move the limiting component. Use the DC bus selection guide for the power boundary, then re-run the full task calculation.
Validate with synchronized electrical and thermal data
Run the representative position, payload and timing on a dynamometer or joint. Record commanded and measured torque, phase current, speed, bus voltage, winding estimate, housing temperature and drive limit flags on one clock. Include cold start and heat-soaked runs.
Compare predicted and measured current, acceleration and temperature. Investigate systematic error instead of spending all margin. Friction, efficiency, inertia or cooling assumptions can be corrected and then applied across other joints.
Release a traceable sizing package
Store trajectory versions, payloads, equations, motor and drive data, gearbox parameters, thermal boundary, margins and hardware test results. Recalculate after motion profile, payload, gearing, enclosure or bus changes.
Use a sign-off checklist.
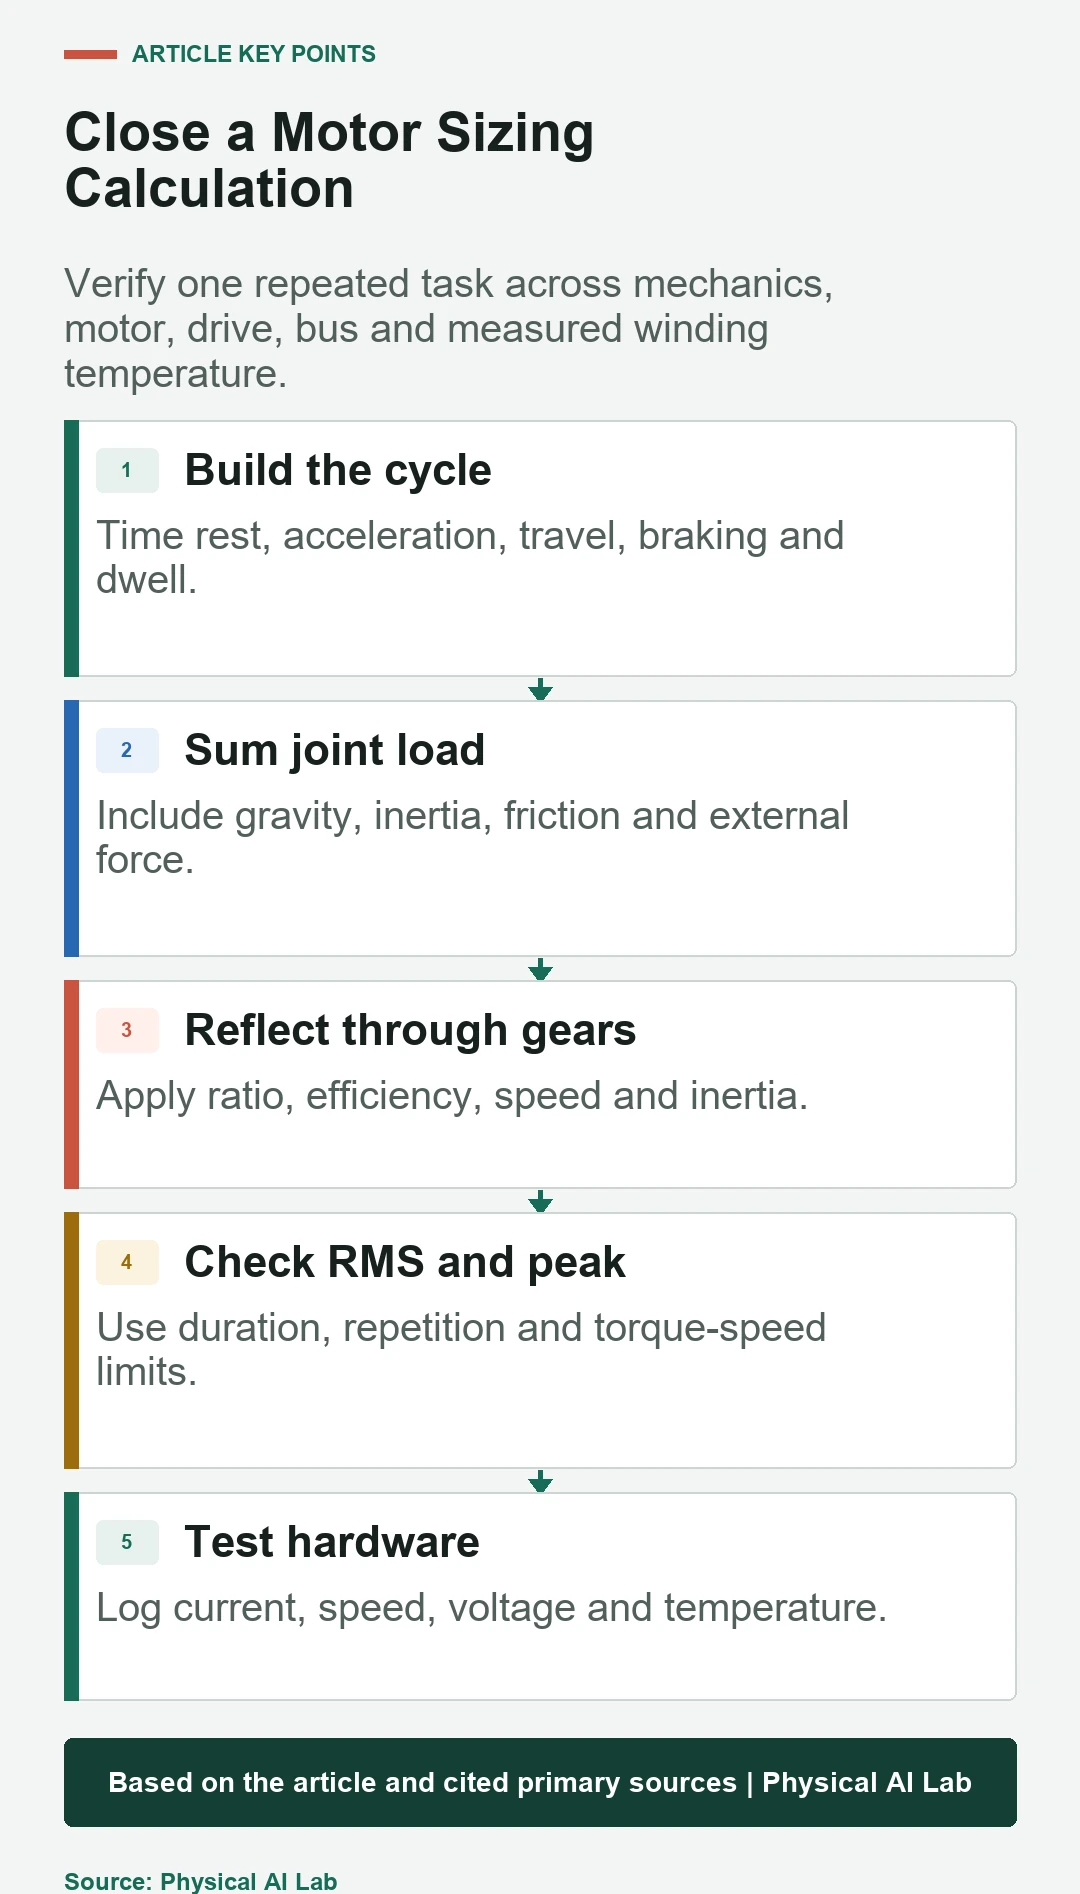
- Build timed torque and speed trajectories.
- Apply gearing, efficiency and reflected inertia consistently.
- Pass RMS, peak duration and torque-speed limits.
- Close drive current, bus voltage and thermal boundaries.
- Correlate the model with heat-soaked hardware tests.
Frequently asked questions
Is RMS torque the same as continuous motor torque?
No. RMS torque is the application heating metric; it must be compared with continuous capability under the actual thermal and speed conditions.
Does enough peak torque guarantee acceleration?
No. The drive current, voltage-speed margin, total reflected inertia and peak duration must also pass.
Does a higher gear ratio always permit a smaller motor?
No. It also raises motor speed and can affect inertia, efficiency, life, backlash and backdrivability.
Should deceleration be included in RMS torque?
Yes when current flows. Negative torque still contributes to winding heating after squaring and may regenerate bus energy.
Is a catalog calculation enough before release?
No. Validate current, speed, limits and temperature on representative hardware and duty cycles.
Motor Calculation and Hardware Validation Boundary
This guide supports engineering analysis, not component approval. Use current supplier data, electrical limits and applicable machinery requirements for the final design.