Humanoid runtime is determined by the complete path from battery cells through protection, the DC bus, inverters, motors and mechanics, plus compute, sensors and cooling. Nominal watt-hours are an upper-level inventory, not the energy available for every task and temperature. Joint power peaks can also exceed what an average number suggests.
The battery-management system limits charge and discharge according to cell voltage, temperature, state of charge and fault conditions. The DC bus must tolerate motor acceleration and returned energy during deceleration. If the pack cannot accept regeneration, another path must prevent overvoltage while preserving the required braking response.
Use this guide with the humanoid battery-runtime guide and robot joint thermal guide. High-energy battery and drive systems require qualified electrical, mechanical, thermal and safety engineering.
Runtime is a duty-cycle result
Break the mission into standing, walking, turning, manipulation, lifting, computing, waiting and recovery. Measure time and energy for each state. An average from one smooth demonstration does not predict a shift with frequent starts, contacts or perception pauses.
Use usable energy after state-of-charge reserve, temperature, aging and protection limits. Divide it by the task-weighted average power only as a first estimate. Validate at several charge states because voltage sag and allowed current change through the pack.

The power path has four conversion boundaries
Cells provide electrochemical energy, the BMS and contactors govern pack availability, the DC bus distributes power, and inverters drive motors that create mechanical torque. Cabling, switches, converters, windings, bearings and transmissions each add loss and voltage drop.
Place measurement points at the pack, bus, representative drives and auxiliary branches. Synchronized electrical and motion logs allow engineers to separate battery limitation, drive efficiency, mechanical loss and task demand.
| Boundary | Input | Output | Key evidence |
|---|---|---|---|
| Battery pack | Cell energy | Protected DC power | Voltage current temperature |
| DC distribution | Pack bus | Branch power | Sag and wiring loss |
| Joint drive | DC power | Phase current | Electrical loss and limits |
| Motor and reducer | Electrical torque | Joint motion | Efficiency and heat |
| Auxiliaries | Bus power | Compute and cooling | Continuous baseline |
The BMS is a real-time boundary manager
A BMS estimates state of charge and health, monitors cell voltage and temperature, balances cells, controls contactors and exposes allowed charge and discharge power. Its limits can change faster than the mission planner expects. A healthy pack can still be temporarily power-limited.
Log actual limits and protection reasons, not only a dashboard percentage. Cell imbalance, low temperature or high state of charge may reduce regenerative acceptance. The TI humanoid robot BMS overview provides one vendor architecture reference, not a complete system validation.
DC bus voltage trades current against insulation
For the same power, higher bus voltage reduces current and resistive loss, which can reduce conductor mass. It also raises component voltage ratings, creepage and clearance requirements, arc and shock hazards, and service complexity. Pack topology and joint electronics must be chosen together.
Measure worst bus sag during simultaneous joint acceleration and compute peaks. A nominally sufficient inverter can enter undervoltage or torque limiting when wiring, connectors and contactors add drop. Protect and instrument the bus at relevant branches.
Peak and continuous power impose different limits
A jump, disturbance recovery or coordinated lift can demand high current for a short interval. Continuous standing, walking and computing determine thermal equilibrium. Cells, contactors, wires, inverter silicon, motors and reducers have different transient and continuous limits.
Use time-current and thermal models with measured duty cycles. Verify recovery between peaks. A drive that survives one burst may overheat during repeated gait cycles, while a battery capable of average power may trip on one synchronized event.
| Load case | Dominant limit | Measurement | Failure signal |
|---|---|---|---|
| Fast acceleration | Peak discharge | Bus current and sag | Undervoltage |
| Continuous walk | Thermal steady state | Temperature and energy | Derating |
| Static pose | Joint holding loss | Torque and winding heat | Local overheat |
| Compute pause | Auxiliary baseline | Branch power | Runtime erosion |
| Emergency braking | Charge acceptance | Bus overvoltage | Drive trip |
Auxiliary loads continuously consume runtime
Computers, cameras, LiDAR, networks, pumps, fans and DC converters may draw less than the joints at peak but run throughout the mission. Their fraction grows during standing, planning and waiting. Separate branch measurements reveal whether compute optimization or actuator efficiency offers the larger gain.
Record which services and sensors are active in every robot state. A perception model that saves mechanical time but doubles compute power may still improve total energy; another may reduce runtime. Judge energy per completed task, not one subsystem in isolation.
Regeneration returns deceleration energy to the bus
When a motor applies torque opposite its motion, mechanical energy can flow through the inverter back to the DC bus. Other joints and auxiliaries may consume it immediately, or the pack may accept charge. Friction and conversion losses mean not all descending or braking energy is recovered.
Measure bus power with signs preserved and align it to joint torque and velocity. Do not infer regeneration from negative motor power alone. The return path, contactor state, converter direction and active loads decide where energy goes.
A full pack can turn regeneration into overvoltage
At high state of charge, low temperature or a cell limit, the BMS may reduce permitted charge power. Several joints braking together can then raise bus voltage. The inverter may fault or change braking behavior at precisely the moment a controlled stop is needed.
Test coordinated deceleration, descending motion and emergency-stop scenarios at high charge and temperature boundaries. Log allowed charge power, bus peak, braking resistor operation and mechanical stopping outcome. Protective design must not depend on a conveniently empty battery.
Dump resistors and storage provide alternate energy paths
A braking chopper can send excess bus energy to a resistor. DC-link capacitors absorb short transients, and a separate storage device may buffer larger events. Each option needs voltage thresholds, energy sizing, repetition rate, temperature monitoring and fault behavior.
Verify open, short, overheated and unavailable-energy-sink cases. A resistor sized for one stop can overheat during repeated tests. Coordinate the electrical escape path with drive control and mechanical stopping so protection remains predictable.
Validate normal tasks and boundary conditions separately
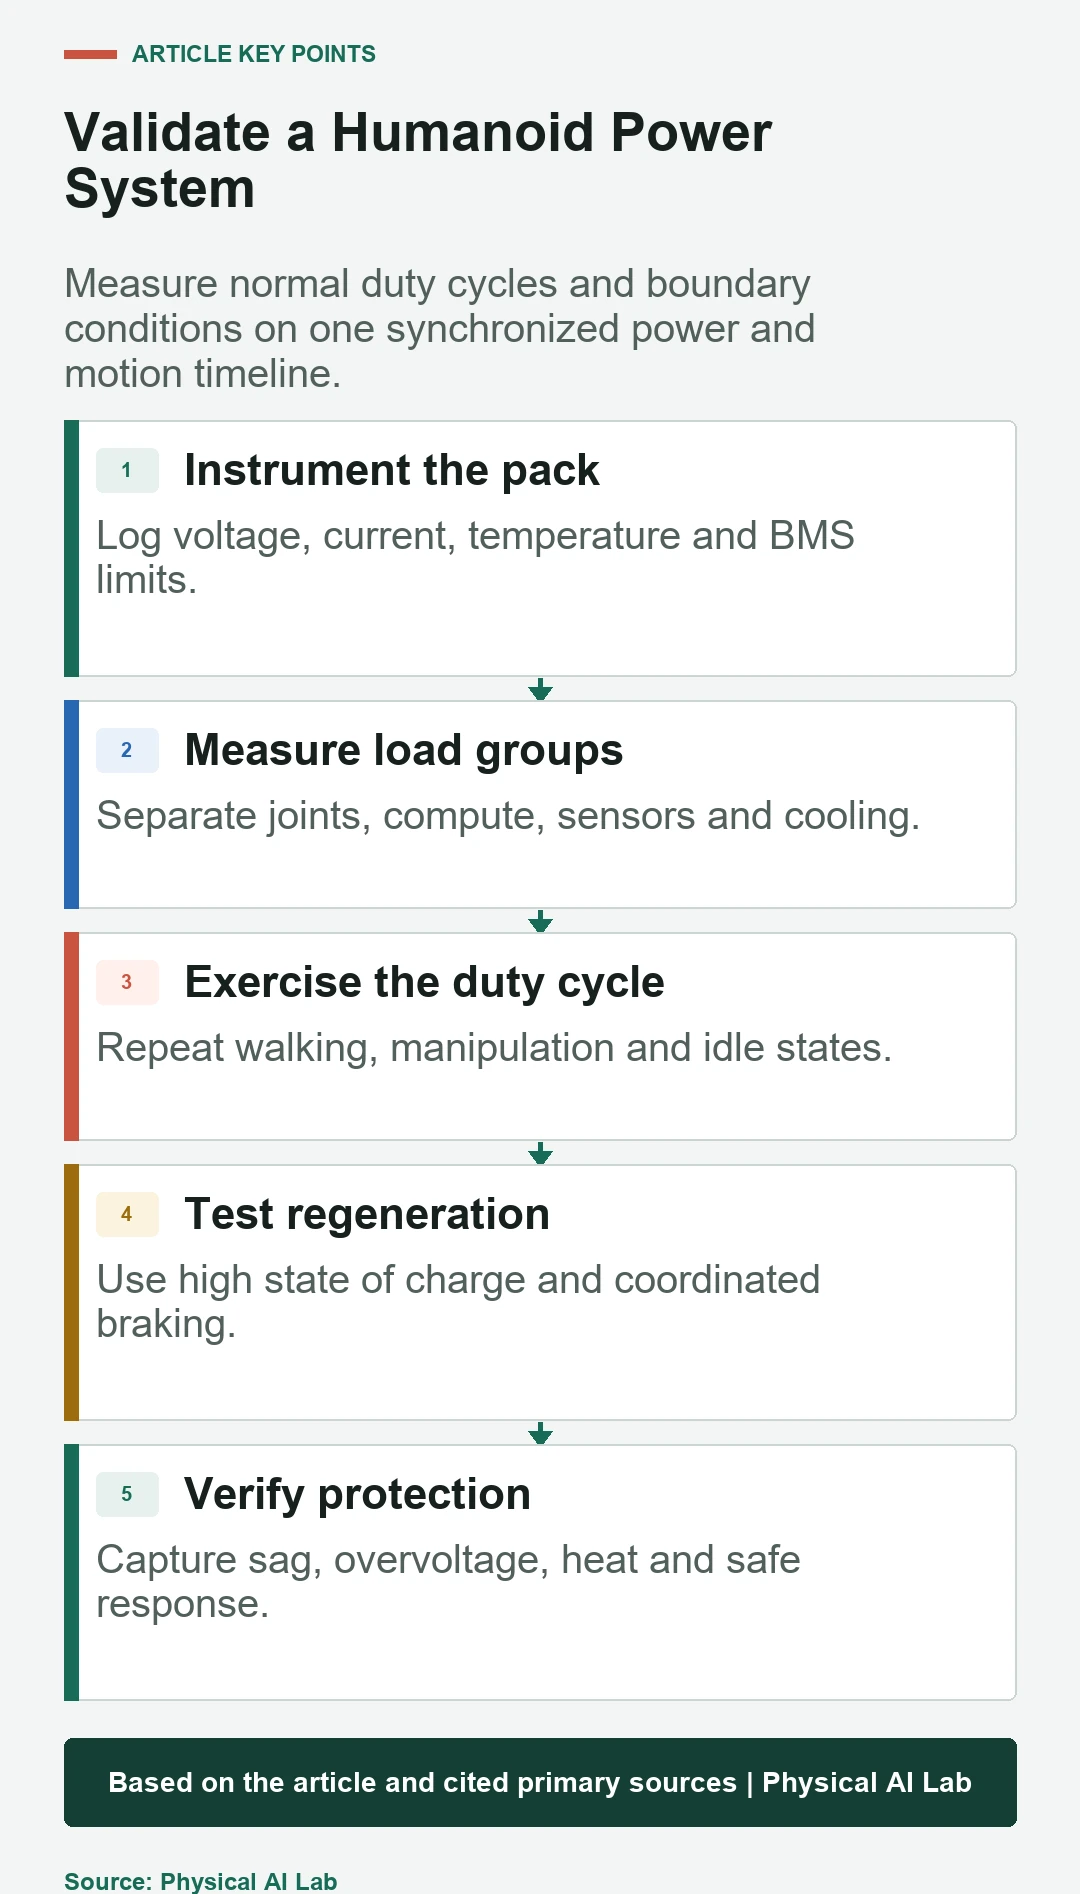
Begin with branch baselines and individual joints, then run synchronized whole-body tasks. Add low and high charge, hot and cold operation, degraded cooling, peak compute load and repeated braking. Define stop criteria before the test.
Acceptance should cover completed work, energy per cycle, minimum bus voltage, maximum overvoltage, temperature, BMS limitations, contactor events and recovery. Repeat until heat reaches equilibrium. Store synchronized logs rather than relying on display screenshots.
Close power, control, thermal and safety evidence together
Overlay power limits with controller modes and thermal derating. A torque reduction can originate in the BMS, inverter, motor temperature, planner or a protective function. Operators need a diagnosable reason and an approved recovery path.
The TI 48 V joint-drive reference design and its design guide illustrate one circuit-level approach. Apply component data, current regulations and qualified review to the actual pack, joints and enclosure; a reference design does not certify the humanoid.
- Measure usable energy by mission state.
- Log BMS charge and discharge limits.
- Capture bus sag and regenerative overvoltage.
- Separate joint and auxiliary branch power.
- Validate thermal equilibrium and protection recovery.
Frequently asked questions
Will doubling battery watt-hours double runtime?
Only approximately if task demand and efficiency stay constant. Added mass, reserve, temperature, current limits and auxiliary loads can change the result.
Is a higher DC bus voltage always better?
No. It can reduce current and wiring loss but increases insulation, component-rating, shock, arc and maintenance requirements.
Can regenerative braking greatly extend runtime?
It helps when the task has useful deceleration or descent and the bus or battery can accept energy. Friction, conversion loss and charge limits reduce recovery.
Is the BMS state-of-charge display enough for testing?
No. Log pack voltage, current, temperature, cell spread, allowed charge and discharge power, contactor state and protection events.
Where should power instrumentation start?
Begin at the pack output and DC bus, then add representative high-power joints and compute or cooling branches so peaks and continuous loads can be separated.
Humanoid Power-System Boundary
Battery packs and high-power robot buses can create fire, shock, arc and uncontrolled-motion hazards. Design and test them under applicable regulations, manufacturer requirements and qualified safety procedures.