The Physical AI industry in 2026 is moving from impressive single-task demonstrations toward a harder question: can robots repeat useful work across shifts, sites and changing conditions at an acceptable total cost? A credible outlook therefore separates model progress from deployed throughput, uptime and service obligations.
Demand is real but uneven. Industrial robots, professional service robots, mobile systems and emerging humanoids have different buyers, sales channels and evidence standards. Shipment counts show activity; they do not by themselves show profitable integration, reliable operation or customer payback.
This outlook connects the logistics AI system guide with the robot data factory. Market claims should be checked against dated primary sources, disclosed samples and the economics of the exact workflow.
Robot growth and customer value are different measurements
The International Federation of Robotics World Robotics 2025 summary reports 542,000 industrial robot installations in 2024 and almost 200,000 professional service robots sold. Those figures describe market activity across defined categories, not the realized productivity of every installation.
IFR also warns that its service-robot data is based on a supplier sample whose composition can change. Compare like categories and years, then add customer evidence: accepted cells, active sites, utilization, intervention, support cost and renewal. A shipment becomes economic value only after integration and sustained use.
Transportation and logistics have the clearest near-term volume signal
IFR reports that transportation and logistics accounted for more than half of professional service robot units in its 2024 sample. Structured routes, measurable moves and persistent staffing pressure make internal logistics easier to specify than open-ended household assistance.
Even here, the robot is one component. Fleet orchestration, maps, charging, wireless coverage, handoff equipment, exception queues and warehouse software determine throughput. Buyers should compare completed work per operating hour and recovery burden rather than advertised navigation features.

Humanoid progress should be read as a deployment ladder
Humanoids attract attention because a human-shaped body may reuse tools, aisles and workstations. The near-term commercial test is narrower: whether one defined sequence can be repeated with controlled variation, safe recovery and supportable maintenance.
Separate a staged clip, a continuous demonstration, a pilot, a paid deployment and multi-site renewal. Ask for trial denominators, interventions, operating hours and workcell changes. A broader policy matters commercially only when it reduces changeover and integration effort without shifting unacceptable risk downstream.
| Evidence level | What it establishes | Missing question | Buyer check |
|---|---|---|---|
| Demonstration | A capability can be shown | Repeatability | Continuous trials |
| Pilot | Workflow fit at one site | Scalability | Hours and interventions |
| Paid deployment | Customer will fund use | Unit economics | Contract and support |
| Multi-site rollout | Some transfer is possible | Fleet variance | Site comparison |
| Renewal or expansion | Ongoing value is plausible | Long-term margin | Total lifecycle cost |
Integration capacity is a market constraint
Robot deployment requires end effectors, fixtures, safety design, controls, data interfaces, commissioning and operator procedures. Shortages in application engineering or slow site acceptance can limit revenue even when robot production expands.
Estimate engineering hours per deployment, reuse across sites, acceptance-test duration and post-startup support. A vendor that standardizes interfaces and recovery procedures may scale more effectively than one with a more capable robot that needs bespoke work for every customer.
Hardware sets the boundary for model performance
Actuator torque density, thermal limits, battery energy, sensor reliability and maintainability determine what a policy can execute repeatedly. Peak demonstrations can hide derating, recharge, wear or calibration work that appears during a full shift.
Track payload through the real reach envelope, continuous rather than peak output, energy per completed task and mean time to restore service. Hardware and software should be evaluated as one operating system because model updates cannot remove physical duty-cycle limits.
Models and data compete on task-change cost
Vision-language-action models and broader robot policies aim to reduce the data and engineering needed for a new task. The commercial metric is not benchmark score alone; it is the time, demonstrations, validation and recovery engineering required to reach an accepted production state.
A deployment data loop can turn interventions and failures into targeted evaluation and retraining. Preserve task definitions, robot configuration and policy versions so improvements are measurable. Generalization claims should state the robots, objects, sites and safety envelope actually tested.
Safety remains a separate engineering and business layer
Learned perception and control do not replace risk assessment, verified limits, protective functions or operating procedures. The Physical AI safety layers guide explains why independent controls remain necessary when uncertainty reaches people and equipment.
Safety engineering affects layout, speed, tooling, commissioning and insurance. Treat it as part of product cost and deployment time, not a late compliance item. Evidence should identify the complete system and operating domain rather than imply that a capable model certifies the application.
| Market metric | Useful interpretation | Common mistake | Better companion metric |
|---|---|---|---|
| Units shipped | Supplier activity | Assuming productive use | Accepted installations |
| Pilot count | Customer interest | Counting every trial as revenue | Paid conversions |
| Task success | Capability under test | Ignoring intervention | Success per unattended hour |
| Uptime | Availability | Excluding planned support | Total service burden |
| Gross margin | Vendor economics | Ignoring integration cost | Margin after deployment support |
RaaS changes cash flow but not operating responsibility
Robotics-as-a-service can reduce customer capital expense and align payments with use. It also leaves the provider exposed to utilization, maintenance, financing and early-termination risk. Contract design can move risk, but it cannot eliminate poor reliability.
Read the billing unit, minimum commitment, uptime definition, excluded downtime, consumables, site obligations and data rights. Providers need enough field observability to price support and enough standardization to prevent every deployment from becoming a custom project.
A supplier scorecard needs operating evidence
Evaluate workflow fit, integration readiness, safety scope, reliability, service coverage, cybersecurity, data governance and unit economics. Score evidence quality separately from the claimed feature so a measured production result is not treated like a roadmap statement.
Request reference sites with comparable loads and environments. Recalculate payback with realistic utilization, ramp time and fallback labor. Sensitivity analysis should include lower volume, longer commissioning, battery replacement and a support visit rather than only the vendor’s nominal case.
The practical 2026 decision is where repetition is already valuable
The strongest opportunities pair constrained, frequent work with measurable outcomes and an integration path that can be reused. Internal logistics, machine tending, inspection and selected material handling often fit this pattern better than unconstrained general assistance.
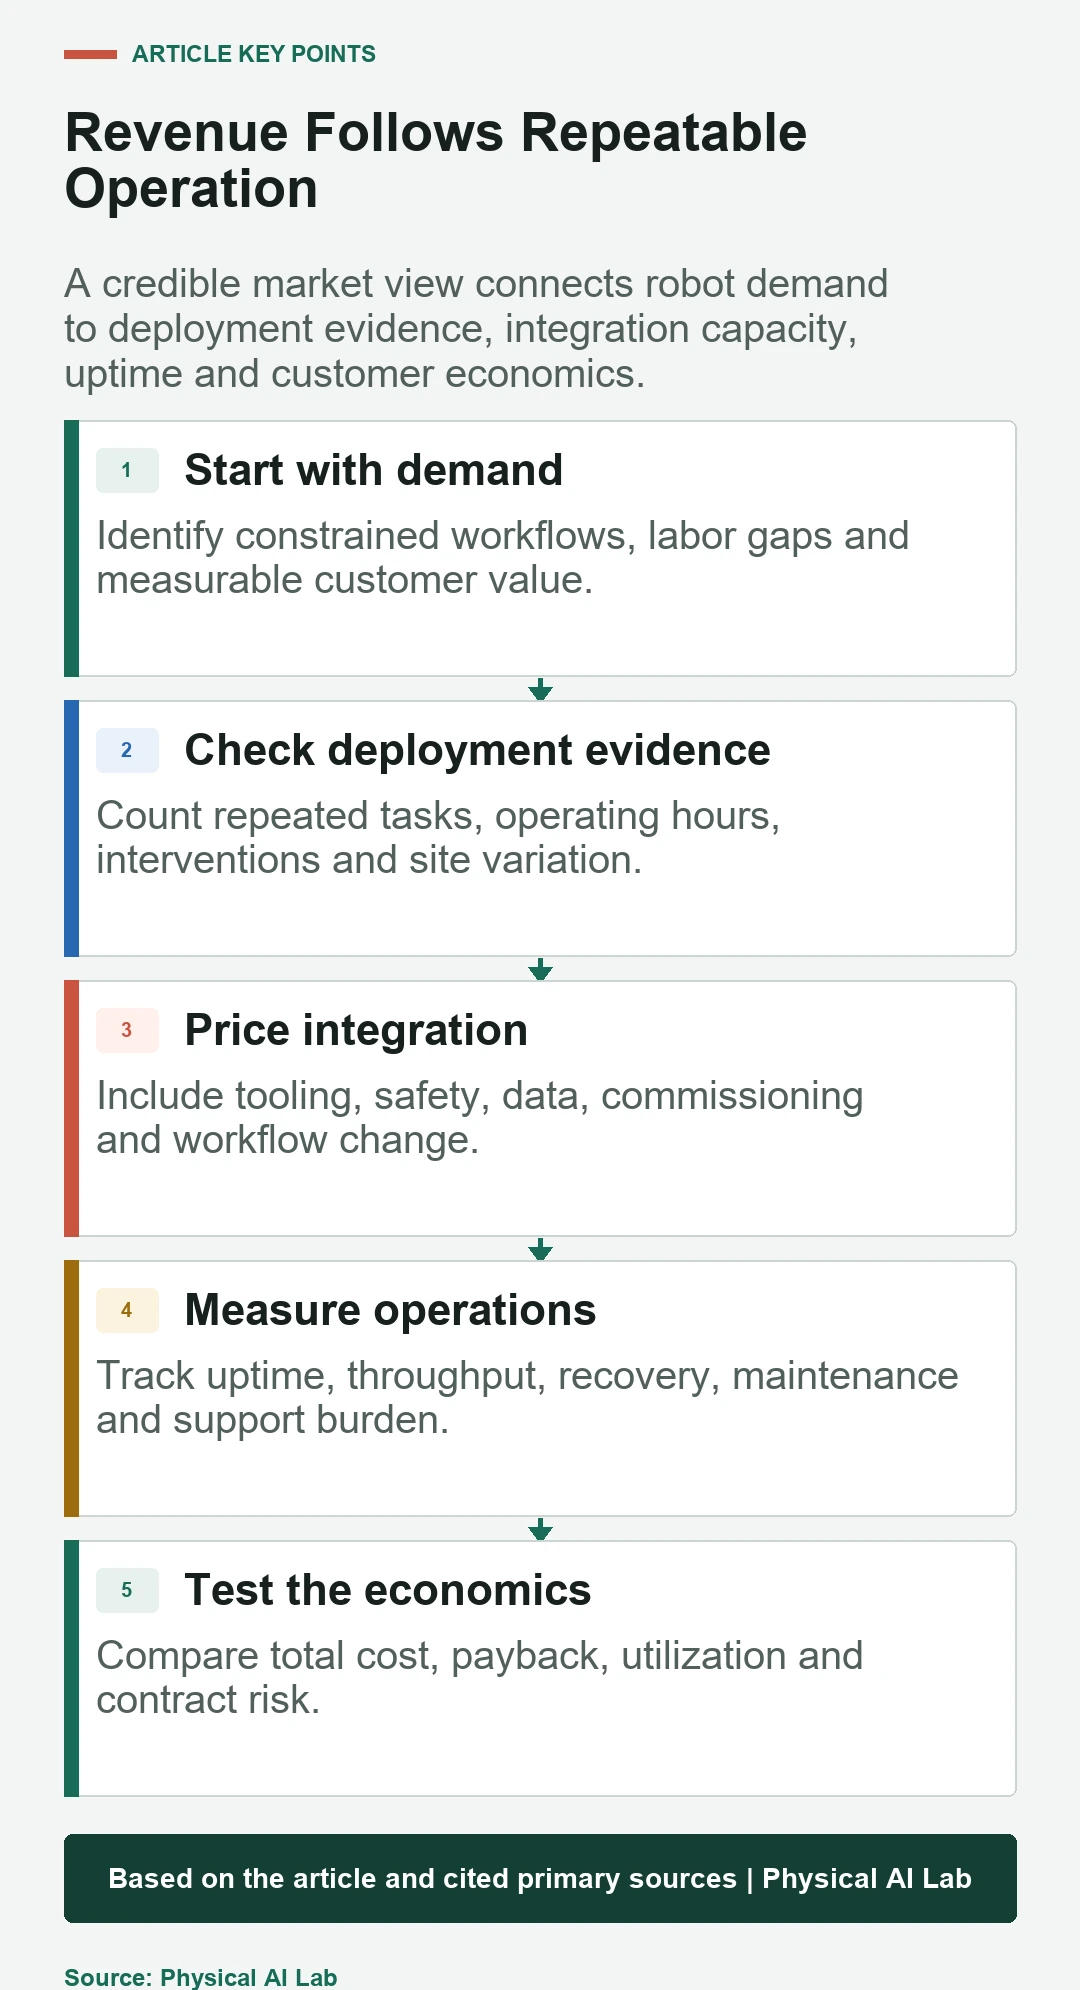
Start with one workflow and a baseline, then define acceptance, safety, recovery and economic gates before choosing hardware or models. Expand only when operating evidence survives different shifts, objects and sites. This approach captures Physical AI progress without turning a fast-moving market into an undated prediction.
- Define the customer workflow and baseline cost.
- Separate demonstrations, pilots and paid operations.
- Price integration, safety, maintenance and support.
- Measure uptime, intervention and completed work.
- Expand only after repeatable multi-condition evidence.
Frequently asked questions
Which Physical AI segment has the clearest near-term demand?
Transportation and logistics show strong professional-service-robot volume, but each project still depends on site integration, recovery and total operating cost.
Do rising robot shipments prove profitable deployment?
No. Shipments show market activity. Profitability requires accepted installations, utilization, uptime, support efficiency and customer renewal.
Will humanoids replace industrial robots in 2026?
Broad replacement is not established. Humanoids and fixed automation will coexist, with each chosen for workflow, flexibility, safety and economics.
What should a buyer measure during a pilot?
Measure completed work, uptime, intervention, recovery time, quality, safety events, integration effort and cost against the existing process.
How often should an industry outlook be updated?
Update dated market statistics and company deployment claims when new primary evidence appears, while keeping general engineering criteria stable.
Market Evidence Note
Market figures were checked against IFR's World Robotics 2025 public summary on July 29, 2026. Service-robot figures are sample based, categories differ, and shipment data should not be interpreted as customer ROI or audited vendor revenue.